Mathcad: A graphical calculation program for engineering professionals.
"Mathcad is computer software for the verification, validation, documentation and re-use of mathematical calculations in engineering and science, notably mechanical, chemical, electrical, and civil engineering. Released in 1986 on DOS, it introduced live editing (WYSIWYG) of typeset mathematical notation in an interactive notebook, combined with automatic computations. It was originally developed by Mathsoft, and since 2006 has been a product of Parametric Technology Corporation."
The paragraph above is how Mathcad is described in Wikipedia. Version 2.5 for DOS is available for download at the WinWorld website, where you also find the complete documentation of the software in PDF format. The application download archive contains six 5.25" 360kB floppy diskettes. Only the first two are needed to run the program, the other 4 contain advanced examples.
The tutorial is about the installation of Mathcad 2.5 on a VMware Workstation 16 FreeDOS 1.3 RC5 virtual machine. It should also apply to MS-DOS 6.2 and other DOS platforms.
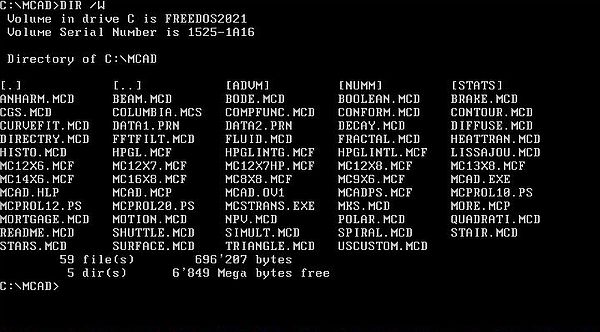
There is no installation program, thus, just copy the diskettes content onto your harddisk. I copied the first two diskettes to c:\mcad, disks 3 and 4 to c:\mcad\stats, (not overwriting the 2 double files, and then copying these files with a new name), disk 5 to c:\mcad\numm, and disk 6 to c:\mcad\advm.
The screenshot below shows the content of my installation directory.
|
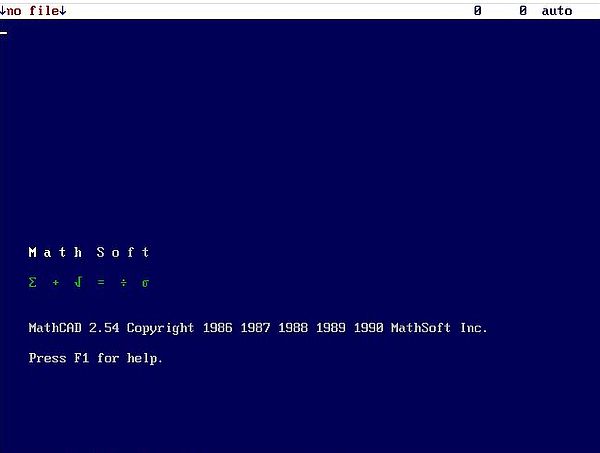
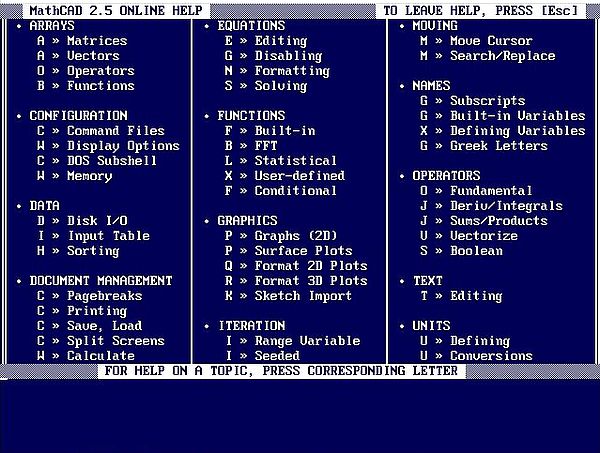
The executable is called mcad.exe. The screenshots below show the Mathcad startup screen (on the left), and the first help screen (for help, push the F1 key) (screenshot on the right).
|
|
On the screenshot on the left, you can see that the screen is divided into 2 areas: at the top, the command line, where you can enter general commands like clear to clear the workspace, and quit to exit Mathcad; at the bottom, the workspace, where you can enter mathematics formulas and descriptive text. To switch from the workspace to the command line, hit the ESC key.
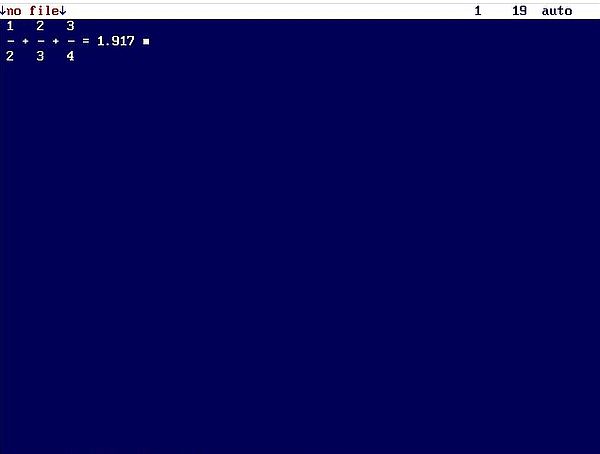
To enter a formula, you enter numbers, operators, and variable names (that you defined before). You use special characters to enter Mathcad functions and to make Mathcad do something. It's really user-friendly and easy; of course, you'll have to learn what symbol to use for a given function or task. When entering a formula, Mathcad displays it "as it would be printed in a book". A simple example: Addition of 3 fractions: Just enter 1 / 2 + 2 / 3 + 3 / 4. Mathcad displays the fractions while you're typing; to display the result of a formula, use the equal sign (=). The default display is 3 digits after the decimal point; for numbers less than 0.001 or greater than 1000, exponential notation will be used by default.
|
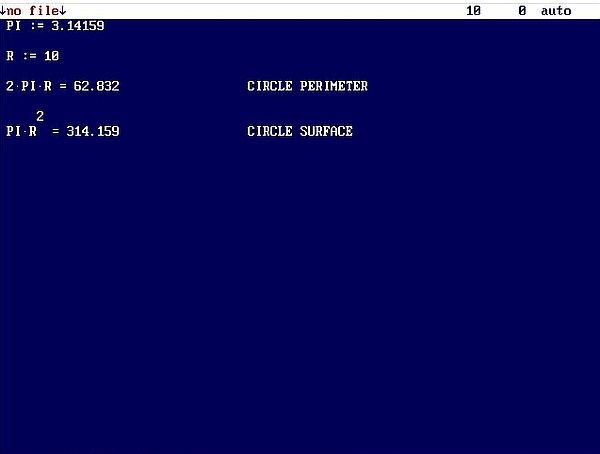
The screenshot below shows the declaration/assignment of variables, their usage in a formula, and the addition of descriptive text. To declare and assign a variable, enter the variable name, followed by an equal sign (=); Mathcad will transform this input to <variable-name> :=, and you can then enter a value for this variable. Hit ENTER to terminate the declaration and go to a new line. With the variable assigned, you can use it in your formulas. As I said above, Mathcad transforms the formula to a format "as it would be printed in a book": entering the division operator slash (/) will generate a fraction, the multiplication operator asterisk (*) will be transformed into a middle dot (·), entering the power operator caret (^) will display the following input as superscript (as in R2 on the screenshot). The Mathcad workspace is a full screen editor, thus, you can freely move around using the arrow keys. This allows, for example, to add some descriptive text somewhere behind your formulas. Start to input text by entering a double quote ("). Mathcad will add the closing quote and you can enter your text (between the two quotes). When leaving the text area, the quotes will be removed.
|
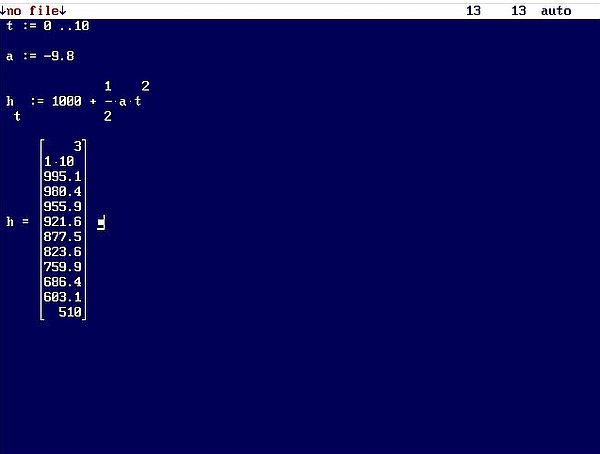
Lots of scientific calculations require data ranges, as in the following example, where we go to plot a graph of the height vs. time, for an object falling from an initial height due to gravity. Lets assume that h0 = 1000m, g = 9.81 m/s2 and lets draw the graph for t = 0 to 10 seconds. We can assign a range to a variable by entering the starting value of the range followed by a semicolon (;). Mathcad replaces the semicolon by a space followed by two dots, and we can then enter the ending value of the range (as in t := 0 ..10 on the screenshot further down).
To create a formula for a function depending on a given (range) variable, we give the function a name that includes the range variable, that it depends on. as subscript; in our example: ht. The Mathcad symbol to create a subscript is the left square bracket ([). Thus to define the function ht = 1000 + (1/2)·g·t2 (free fall function height vs. time), we enter the following: h[ (causing Mathcad to start a subscript), then t followed by a space (causing Mathcad to end the subscript), then an equal sign (that Mathcad replaces by :=), and the formula 1000 + 1/2 * g * t^2 (Mathcad replacing 1/2 by a fraction, * by a middle dot and t^2 by t2, as you can see on the screenshot).
Now with everything defined, we can evaluate the function ht for t = 0 to 10, by simply entering h=. This will display the table as shown below.
|
Note: Mathcad includes a nice copy/cut and paste feature. For example, to copy or cut the table (this includes the equation that generated it), push F2 = Copy, or F3 = Cut, move to another location on the screen and push F4 = Paste.
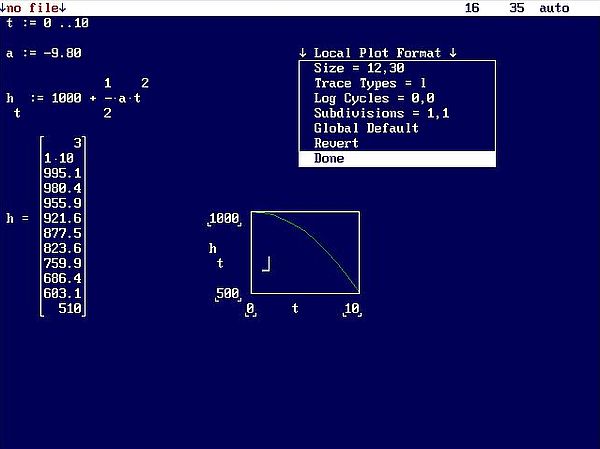
Creating a graph form the table data above is more than easy. First, move the cursor to the right of the table, but outside the placeholder area (shown as a little square). Then enter the symbol for table creation: @. This will display a rectangle (area where the graph will be printed) with 3 placeholders at its left, and 3 placeholders at its bottom. The middle one of these placeholders have to contain the variables for the x-axis and y-axis respectively (in our case t and ht. The other placeholders may be used to enter the minimum and maximum value for x resp. y (these are filled in automatically if not specified).
As you can see on the screenshot below, the graph generated is rather small by default. We can make it bigger by placing the cursor within the graph area, and entering the symbol for format: f. This opens a selection window, including several items, among which there is Size. I changed the original values of "6, 15" to "12, 30". When all wanted formatting is terminated, select the last item in the window: Done.
|
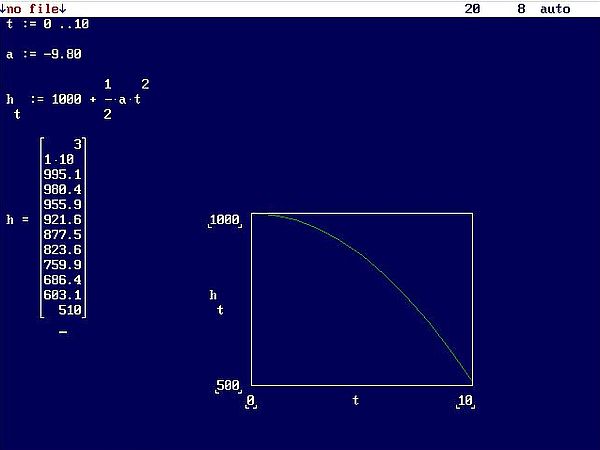
The screenshot below shows the free fall graph after formatting (width and height of the graph doubled in size).
|
At the beginning of the tutorial, I said that to execute a command like clearing the workspace or exiting the program, we have to pass to the command line at the top of the screen (using ESC) and entering the command as text. There is another, much simpler way: Use F10 to display the program's menu bar, that contains items like File, Edit/Move, Compute, etc. To open the submenu of one of the menu bar items, simply push its first letter's key on the keyboard. Then, to choose an item in the submenu, use the arrow keys to select it and hit ENTER.
The Mathcad installation diskettes include numerous examples, that we can open using the menu command File > Load (screenshot on the left). Doing so hides the menu bar; instead the text "File to load:" is displayed. Either enter a filename, or just hit ENTER; this will display a list with the files in the current directory, that you can select using the arrow keys and then open by hitting ENTER (screenshot on the right).
![Mathcad 2.5 on FreeDOS: Opening a Mathcad file [1] Mathcad 2.5 on FreeDOS: Opening a Mathcad file [1]](./screenshots/mathcad8a.jpg)
|
![Mathcad 2.5 on FreeDOS: Opening a Mathcad file [2] Mathcad 2.5 on FreeDOS: Opening a Mathcad file [2]](./screenshots/mathcad8b.jpg)
|
Note: A quick way to open (or save) a file is to use the function keys: F5 = Load file, and F6 = Save file.
The file decay.mcd is a scientific report concerning the radioactive decay of two chemical elements A and B. The report contains lots of text (use the PageUp and PageDown keys to navigate within the report) showing the initial conditions, and explaining in detail how the calculations have been done (screenshot on the left). The final result of the calculations is a graph showing the variation of the mass of A and B over time (screenshot on the right).
![Mathcad 2.5 on FreeDOS: Example - Radioactive decay [1] Mathcad 2.5 on FreeDOS: Example - Radioactive decay [1]](./screenshots/mathcad9a.jpg)
|
![Mathcad 2.5 on FreeDOS: Example - Radioactive decay [2] Mathcad 2.5 on FreeDOS: Example - Radioactive decay [2]](./screenshots/mathcad9b.jpg)
|
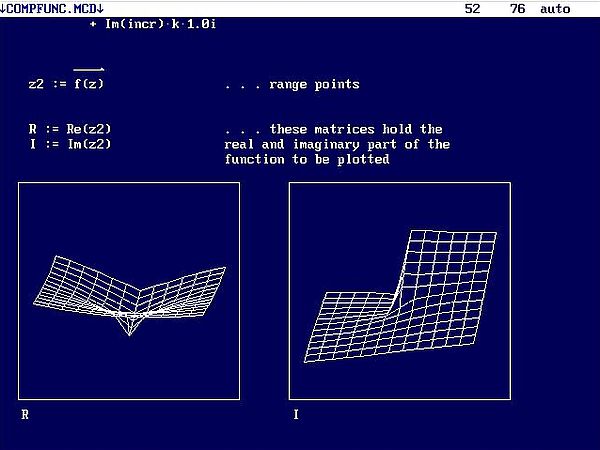
Graphs are not limited to 2 dimensions; we can also create 3D-plots with Mathcad. Those are, obviously, limited by the small resolution of the DOS screen. But, as you can see on the screenshot below (file compfunc.mcd = visualization of a complex function), nice and comprehensive graphs are possible.
|
If you like this page, please, support me and this website by signing my guestbook.