Drawing of mathematical and other functions using Gnuplot.
| Download FunctionPlotter desktop application (Windows 64bit) | Download FunctionPlotter source code (Lazarus/Free Pascal) |
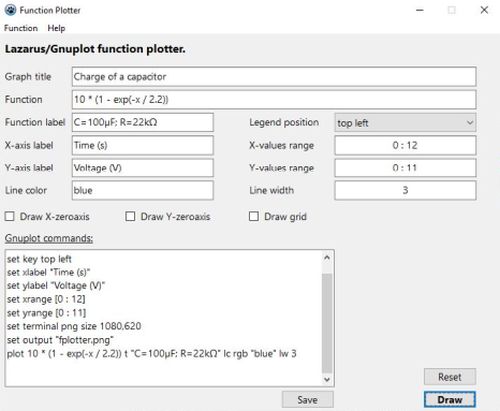
Description: "FunctionPlotter" is a Lazarus/Free Pascal application that can be used to draw simple graphs (functions). In fact, the drawing
is done by the freeware program Gnuplot (that you'll have to download and install in order to use "FunctionPlotter"). The user can enter the function as a simple string,
as for example: sin(x). Other graph properties or parameters can also be set, in particular the range of the x- and y-axis values. The Gnuplot commands used to generate
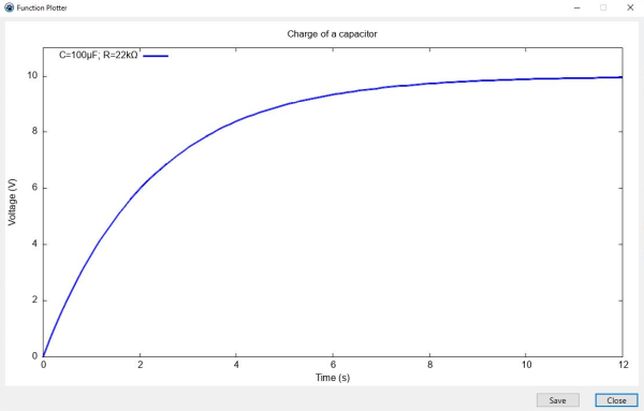
the graph can be saved as PLT file. The graph itself can be saved as PNG graphics file. The latest version 2.0 allows to draw two graphs on the same plot.
Change log:
Version 1.0 (August 2024): Original program
Version 2.0 (December 2004):
- added "2 functions plot" feature
Free Pascal features: Running command line programs from within a Free Pascal GUI application. Running Windows Cmd commands from within a Free
Pascal GUI application. Usage of the "Save" dialog. Using TImage components to display graphics files.
Screenshots:

|

|
If you like this application, please, support me and this website by signing my guestbook.